Aurora Visualize™
Real-time Visualization and Control for Emitter and Back Surface Field Fabrication
Aurora Visualize enables optimization and control of diffusion and annealing processes by providing operators and process engineers with real-time visualization of intra-furnace dynamics, both spatially and by batch. Visualize also includes comprehensive historical trending and analysis of key process output parameters along with statistical process analysis.
Description
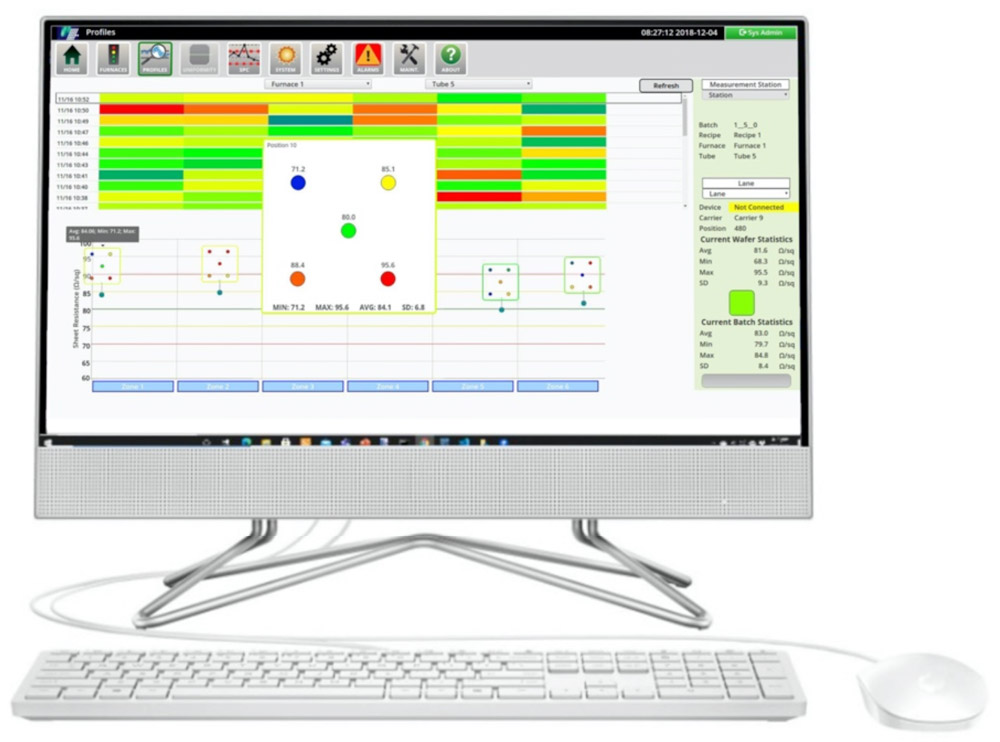
Aurora Visualize combines high-resolution doped layer measurements from Aurora’s DMTM series products with wafer positions within the furnaces to visualize and characterize process performance. This enables PV cell manufacturers to easily manage and control the performance of emitter formation with a complete understanding of process dynamics, batch after batch.
By presenting easy to interpret graphical visualizations, Visualize enables production operators to quickly detect, diagnose and resolve process issues. Process engineers can much more easily and efficiently adjust and optimize furnace parameters leading to higher yield of top-quality cells. This opens the door to substantial cost savings for solar cell
manufacturers and has a positive impact on profitability.
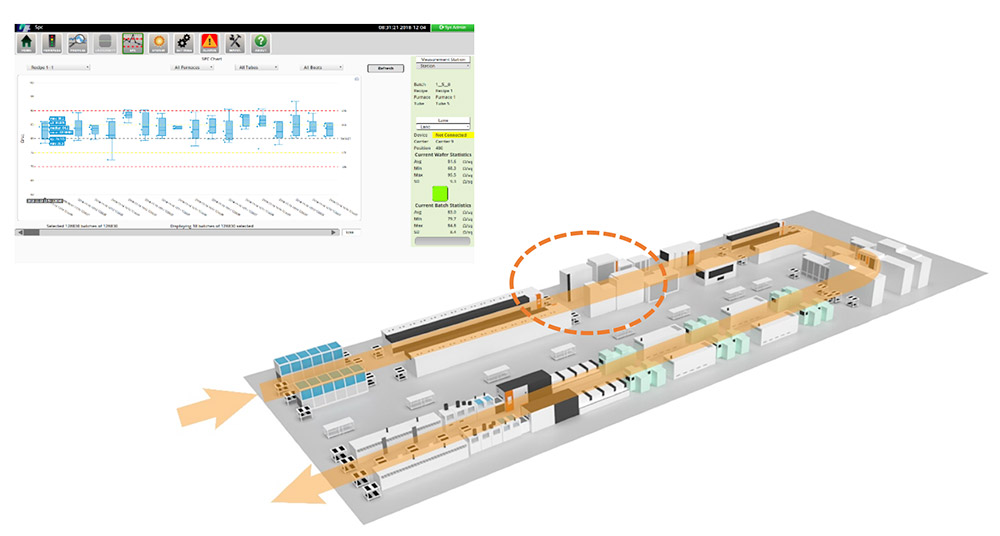
Visualize supports the manufacturing team by continuously monitoring the quality of every emitter and comparing them to SPC targets. Out-of-specification conditions are alarmed and highlighted in intuitive graphical displays that make it easy for operators and process engineers to diagnose issues and quickly address areas of concern. The benefits of such tight monitoring and control are reduced downgraded cells, higher average cell electrical efficiency, increased production line throughput, and elimination of manually intensive sampling and testing of wafers by lab technicians.
Features
- Characterizes the performance of diffusion and annealing furnaces
- Features for both vertical and horizontal stacked furnaces
- Reveals true furnace performance based on position maps within each tube
- Simple to use graphical tools that enable detection and correction of process issues
- SPC reporting and batch/wafer annunciation
Benefits
- Reduction in unwanted cell quality variation
- Higher average cell efficiency due to reduced downgraded cell production
- Faster furnace ramp-up (initially and after maintenance)
- Increased production line throughput
- Rapid payback